Collecting and Recording Your Data
![]() This Resource is part of the Tomatosphere™ Program
This Resource is part of the Tomatosphere™ Program
Designed for: Grades K-8 For use by:
Students, Teachers.
Learning Styles: Interactive (hands-on), Classroom based
Resource Type: Document, Guide
To ensure the consistency of observations made by numerous independent observers, the following criteria will be used to define the condition “successfully germinated”.
For purposes of this experiment, a seed can be considered to have successfully germinated when two (2) distinctly separate cotyledons (embryonic leaves) can be seen.

The primary objective of the experiment is to determine how many of the planted tomato seeds are successfully germinated.
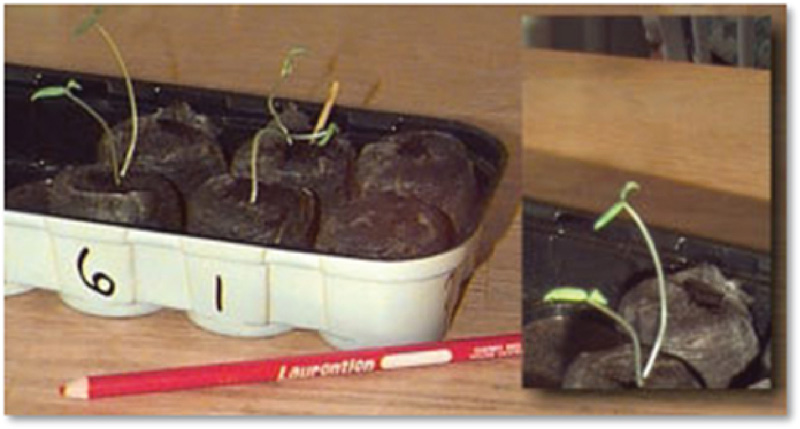
The photo above shows some peat pots with germinated tomato seeds. Note that the seedlings have only their embryonic leaves and no true leaves have yet appeared.
Also note that each seed produces only one stem. The peat pot in the inset photo obviously contains two germinated seeds – evidence of not taking care when planting the seeds. It is important to be certain that each peat pot contains only one seed.
Check your planted seeds each day. The first signs of germination will be a small bud-like structure pushing its way up through the peat in the peat pellet. In some cases the seed coat itself will be pushed upwards as it adheres to a cotyledon like a small helmet.
When two distinct cotyledons appear, germination can be considered to have been successful.
Keeping a class record
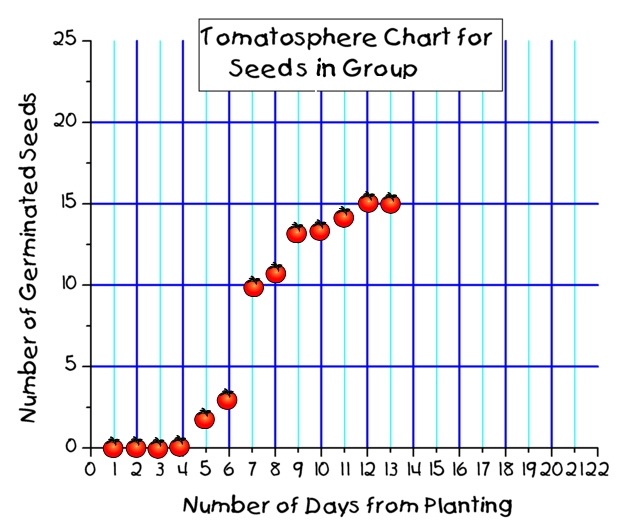
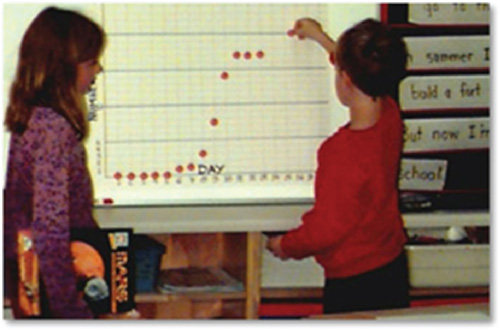
An excellent way to record your observations is to prepare a large data chart, such as the one shown below. Make a separate chart for each group of tomato seeds.
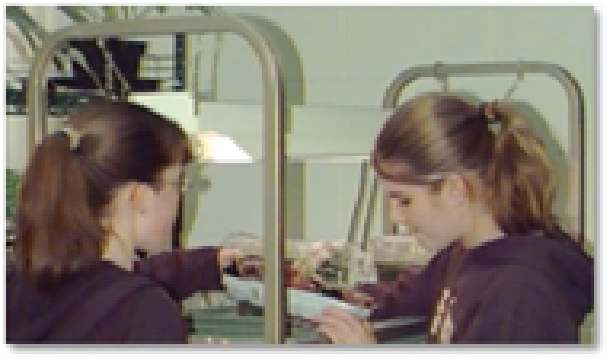
Mark the number of elapsed days from the initial planting on the horizontal axis and the total number of seeds germinated on the vertical axis. Each day plot your class observations on the chart (students in this class have cut-out bright red “tomato markers” to plot their data, but a colored “magic marker” works well). Display the graphs in your classroom where the results can be easily seen. The data collection for the experiment should be done on a daily basis for germination. Each day a different group of students can be responsible for updating the classroom graph.
Detailed and accurate record keeping is an important part of doing science.
- Each student should create a journal to record and track the progress of the experiment.
- The journal should contain two distinct sections for recording observations, one section dedicated to each experimental group of seeds.
- Students should prepare (in advance of starting the experiment) several pages in their journals in which to record each day’s observations. By having the record pages prepared in advance a neat and complete set of observations can be recorded with a minimum risk of observations being forgotten or data being lost.
Note the conditions under which the observations were taken. For example, it would be useful to record the temperature by placing a thermometer in the region of each sample.

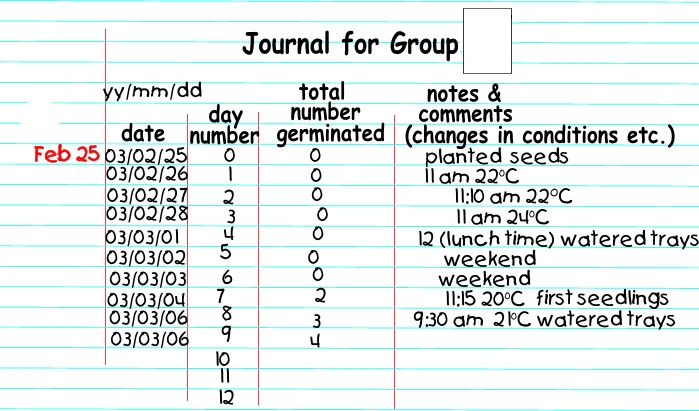
A typical journal page may look similar to the page shown above. Each day an entry is made into the data log, along with any comments or notes which might be useful when interpreting the data. For example, the temperature and the frequency of watering might prove important in understanding differences in germination rates when all the data are finally collected and compared. It is always better to record too much information than not enough information.
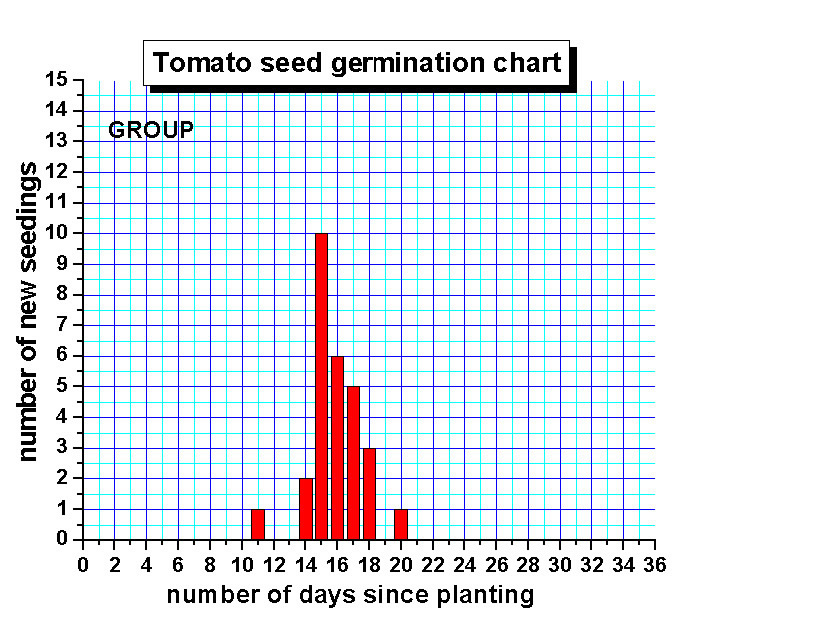
In addition to keeping a table of the observations as the experimental results become available, it is helpful to keep a daily graph showing the progress of the experiment.
There are two kinds of graphs which are helpful.
The graph below plots the number of new seedlings that appear each day.
A sample graph is provided as well as a copy master which can be used to generate class-sets of the blank graph; or you may wish to create you own.
A separate graph should be created for each group of seeds.
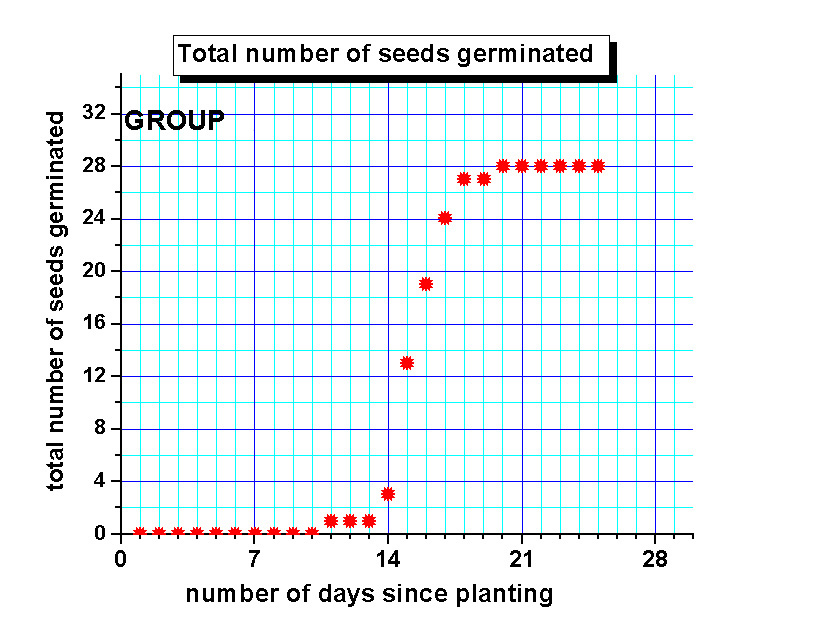
A different way of recording the data is to plot the total number of seedlings which have germinated.
When the graph shows that no further seeds are germinating, the germination part of the experiment is complete. A separate graph should be created for each group of seeds.